Interactive Flamegraphs

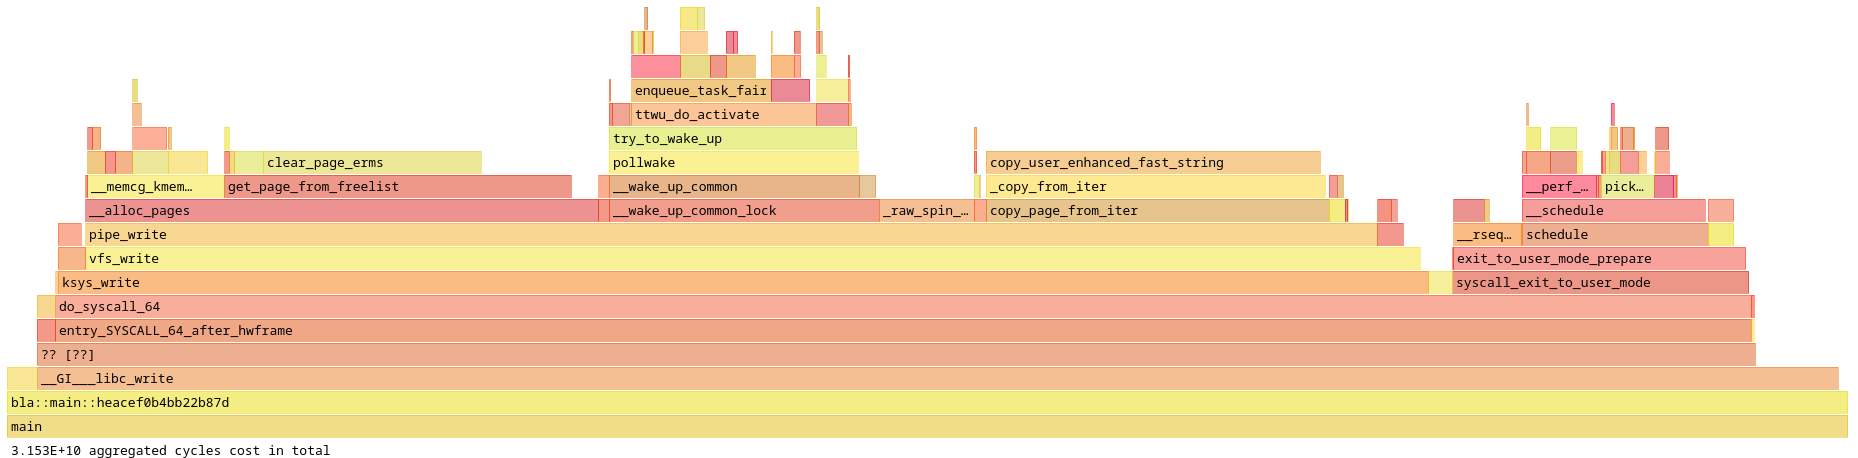
In my latest article, I made heavy use of flamegraphs. To makes things clearer, flamegraphs are visualizations of how much time is spent in each function in a program:

./write –write_with_vmsplice –huge_page –busy_loop | ./read –read_with_splice –busy_loop Profiling of ./write Reset Zoom Search ic __iov_iter_get_pages_alloc (3,949,231,497 samples, 14.88%) __iov_iter_get_pages_a.. __fget_light (62,561,929 samples, 0.24%) internal_get_user_pages_fast (3,133,200,714 samples, 11.81%) internal_get_user.. write (26,541,239,090 samples, 100.00%) write __check_object_size (130,746,843 samples, 0.49%) osq_lock (197,341,424 samples, 0.74%) import_iovec (1,716,063,086 samples, 6.47%) import_i.. __import_iovec (1,666,122,831 samples, 6.28%) __import.. do_mmap (2,892,862 samples, 0.01%) iov_iter_advance (538,480,611 samples, 2.03%) i.. pipe_lock (150,603,536 samples, 0.57%) syscall_enter_from_user_mode (4,006,940 samples, 0.02%) kill_fasync (2,756,081 samples, 0.01%) do_syscall_64 (2,892,862 samples, 0.01%) vm_mmap_pgoff (2,892,862 samples, 0.01%) do_syscall_64 (26,020,596,200 samples, 98.04%) do_syscall_64 arch_get_unmapped_area_topdown (2,892,862 samples, 0.01%) mutex_lock (30,726,118 samples, 0.12%) entry_SYSRETQ_unsafe_stack (8,363,819 samples, 0.03%) mutex_spin_on_owner (5,495,045,988 samples, 20.70%) mutex_spin_on_owner update_process_times (2,662,881 samples, 0.01%) __cond_resched (5,668,335 samples, 0.02%) __fdget (18,709,007 samples, 0.07%) osq_unlock (817,653,660 samples, 3.08%) osq.. syscall_exit_to_user_mode (43,203,238 samples, 0.16%) __sysvec_apic_timer_interrupt (2,662,881 samples, 0.01%) _copy_from_user (1,015,660,918 samples, 3.83%) _cop.. get_pipe_info (88,389,900 samples, 0.33%) tick_sched_handle (2,662,881 samples, 0.01%) asm_sysvec_apic_timer_interrupt (2,662,881 samples, 0.01%) vm_unmapped_area (2,892,862 samples, 0.01%) try_grab_folio (289,286,952 samples, 1.09%) get_user_pages_fast (7,086,063 samples, 0.03%) page_cache_pipe_buf_release (43,300,058 samples, 0.16%) __mutex_lock.constprop.0 (9,759,850,719 samples, 36.77%) __mutex_lock.constprop.0 with_vmsplice (4,241,758 samples, 0.02%) exit_to_user_mode_prepare (30,683,997 samples, 0.12%) pud_huge (4,099,890 samples, 0.02%) mas_empty_area_rev (2,892,862 samples, 0.01%) copy_user_enhanced_fast_string (76,785,562 samples, 0.29%) entry_SYSCALL_64_after_hwframe (26,054,316,296 samples, 98.17%) entry_SYSCALL_64_after_hwframe __do_sys_vmsplice (25,963,594,680 samples, 97.82%) __do_sys_vmsplice wait_for_space (742,762,247 samples, 2.80%) wa.. __hrtimer_run_queues (2,662,881 samples, 0.01%) check_stack_object (58,579,278 samples, 0.22%) get_unmapped_area (2,892,862 samples, 0.01%) entry_SYSCALL_64 (259,954,397 samples, 0.98%) syscall_exit_to_user_mode_prepare (2,750,376 samples, 0.01%) entry_SYSCALL_64_after_hwframe (2,892,862 samples, 0.01%) add_to_pipe (4,557,388,711 samples, 17.17%) add_to_pipe __mmap (2,892,862 samples, 0.01%) iovec_from_user.part.0 (1,403,501,367 samples, 5.29%) iovec_.. hrtimer_interrupt (2,662,881 samples, 0.01%) all (26,541,242,666 samples, 100%) tick_sched_timer (2,662,881 samples, 0.01%) sysvec_apic_timer_interrupt (2,662,881 samples, 0.01%) iov_iter_get_pages2 (3,963,033,797 samples, 14.93%) iov_iter_get_pages2 mutex_unlock (158,874,728 samples, 0.60%) vmsplice (26,534,006,381 samples, 99.97%) vmsplice

The interactive part is what lets you click on a function to focus on its call stack. If this is too small, look at the bottom of the article for a wider version.

In this article, we’ll see how to collect the necessary data, how to generate an interactive SVG to display that data, and how to integrate that SVG in WordPress.

Setup

First, you’ll need to enable event reporting from the kernel by using:

echo -1 | sudo tee /proc/sys/kernel/perf_event_paranoid

You will also want to make sure to compile the program you are profiling with the debug symbols, to identify the functions easily1:

[profile.profiling]
inherits = "release"
debug = true

Shortcut

Now, if you do not really care about having an SVG file to embed somewhere, and you do not care about kernel profiling, you can just use samply.

samply record ./write --write_with_vmsplice --huge_page --busy_loop | ./read --read_with_splice --busy_loop

This opens Firefox Profiler, a Web app in which you can explore the results, even check the corresponding source code, and share it with others.

Collecting Data

The command of reference to collect any kind of performance data is perf. Keeping the same example, we will use:

perf record -o perf.data -g ./write --write_with_vmsplice --huge_page --busy_loop | ./read --read_with_splice --busy_loop

The pipe seems to confuse it, so we explicitly need to add -o perf.data to make it work as expected. If you forget that, you will get this error message:

setting the pipe size failed, are you piping the output somewhere? error: Bad file descriptor

As an aside, you might also be interested in an article of Julia Evans about tracing kernel functions.

Making an SVG file

So far, we were on the most traveled path, using neatly prepacked programs. For this step, we’ll need to download and run some Perl scripts. In our case, we are interested in stackcollapse-perf.pl and flamegraph.pl. The first one parses the output of perf, and the second one outputs the interactive SVG. Assuming your profiling data is named perf.data, you would use:

perf script | stackcollapse-perf.pl | flamegraph.pl --height=24

The --height=24 argument is not necessary, but it does make things a bit more readable.

You can add a title and a subtitle with the corresponding --title="Some title" and --subtitle="Some subtitle" arguments. Note that the text is embedded as-is in the XML of the SVG, so you will need to escape any angle brackets (< and >) as &lt; and &gt;.

Embedded the SVGs in WordPress Articles

If you try to insert the resulting SVG file in a WordPress article2, you will only get a static image because any JavaScript code is stripped for security. Since we do want to keep the JavaScript code in this instance, we’ll have to use a Custom HTML block3.

However, there is still a catch. The JavaScript code contains opening angle brackets (<). In XML, that would be interpreted as an opening tag, making the SVG invalid. To avoid this, the whole JavaScript code is in a CDATA section:

…
</style>
<script type="text/ecmascript">
<![CDATA[
// JavaScript code that can freely use < and &
]]>
</script><rect x="0.0" y="0" width="1200.0" height="310.0" fill="url(#background)"  />
…

Unfortunately, WordPress mangles this. So, we need to remove the <![CDATA[ and ]]> markers (do this directly in the script instead of editing each SVG file). This breaks the SVG for other readers (including opening the SVG file directly in Firefox), but, unfortunately, we cannot do much about it.4

But, at least, it works with WordPress:

./write –write_with_vmsplice –huge_page –busy_loop | ./read –read_with_splice –busy_loop Profiling of ./write Reset Zoom Search ic __iov_iter_get_pages_alloc (3,949,231,497 samples, 14.88%) __iov_iter_get_pages_a.. __fget_light (62,561,929 samples, 0.24%) internal_get_user_pages_fast (3,133,200,714 samples, 11.81%) internal_get_user.. write (26,541,239,090 samples, 100.00%) write __check_object_size (130,746,843 samples, 0.49%) osq_lock (197,341,424 samples, 0.74%) import_iovec (1,716,063,086 samples, 6.47%) import_i.. __import_iovec (1,666,122,831 samples, 6.28%) __import.. do_mmap (2,892,862 samples, 0.01%) iov_iter_advance (538,480,611 samples, 2.03%) i.. pipe_lock (150,603,536 samples, 0.57%) syscall_enter_from_user_mode (4,006,940 samples, 0.02%) kill_fasync (2,756,081 samples, 0.01%) do_syscall_64 (2,892,862 samples, 0.01%) vm_mmap_pgoff (2,892,862 samples, 0.01%) do_syscall_64 (26,020,596,200 samples, 98.04%) do_syscall_64 arch_get_unmapped_area_topdown (2,892,862 samples, 0.01%) mutex_lock (30,726,118 samples, 0.12%) entry_SYSRETQ_unsafe_stack (8,363,819 samples, 0.03%) mutex_spin_on_owner (5,495,045,988 samples, 20.70%) mutex_spin_on_owner update_process_times (2,662,881 samples, 0.01%) __cond_resched (5,668,335 samples, 0.02%) __fdget (18,709,007 samples, 0.07%) osq_unlock (817,653,660 samples, 3.08%) osq.. syscall_exit_to_user_mode (43,203,238 samples, 0.16%) __sysvec_apic_timer_interrupt (2,662,881 samples, 0.01%) _copy_from_user (1,015,660,918 samples, 3.83%) _cop.. get_pipe_info (88,389,900 samples, 0.33%) tick_sched_handle (2,662,881 samples, 0.01%) asm_sysvec_apic_timer_interrupt (2,662,881 samples, 0.01%) vm_unmapped_area (2,892,862 samples, 0.01%) try_grab_folio (289,286,952 samples, 1.09%) get_user_pages_fast (7,086,063 samples, 0.03%) page_cache_pipe_buf_release (43,300,058 samples, 0.16%) __mutex_lock.constprop.0 (9,759,850,719 samples, 36.77%) __mutex_lock.constprop.0 with_vmsplice (4,241,758 samples, 0.02%) exit_to_user_mode_prepare (30,683,997 samples, 0.12%) pud_huge (4,099,890 samples, 0.02%) mas_empty_area_rev (2,892,862 samples, 0.01%) copy_user_enhanced_fast_string (76,785,562 samples, 0.29%) entry_SYSCALL_64_after_hwframe (26,054,316,296 samples, 98.17%) entry_SYSCALL_64_after_hwframe __do_sys_vmsplice (25,963,594,680 samples, 97.82%) __do_sys_vmsplice wait_for_space (742,762,247 samples, 2.80%) wa.. __hrtimer_run_queues (2,662,881 samples, 0.01%) check_stack_object (58,579,278 samples, 0.22%) get_unmapped_area (2,892,862 samples, 0.01%) entry_SYSCALL_64 (259,954,397 samples, 0.98%) syscall_exit_to_user_mode_prepare (2,750,376 samples, 0.01%) entry_SYSCALL_64_after_hwframe (2,892,862 samples, 0.01%) add_to_pipe (4,557,388,711 samples, 17.17%) add_to_pipe __mmap (2,892,862 samples, 0.01%) iovec_from_user.part.0 (1,403,501,367 samples, 5.29%) iovec_.. hrtimer_interrupt (2,662,881 samples, 0.01%) all (26,541,242,666 samples, 100%) tick_sched_timer (2,662,881 samples, 0.01%) sysvec_apic_timer_interrupt (2,662,881 samples, 0.01%) iov_iter_get_pages2 (3,963,033,797 samples, 14.93%) iov_iter_get_pages2 mutex_unlock (158,874,728 samples, 0.60%) vmsplice (26,534,006,381 samples, 99.97%) vmsplice
  1. This is straight from samply‘s README. ↩︎
  2. I used SVG Support. ↩︎
  3. I am using the built-in Gutenberg editor. ↩︎
  4. I did try to use the old <!-- and --> trick from the early Web, but this is still interpreted as a comment in XML, so this makes the image mostly static. ↩︎

Leave a Reply

Your email address will not be published. Required fields are marked *